Unleash the Power of ParaView
ParaView is the world’s leading open source post-processing visualization engine.
Using ParaView on the Web and In Situ
Our award-winning software allows you to analyze and visualize data in any setting, from supercomputers to analyze exascale datasets to laptops for smaller-sized data. It can also be run in situ using ParaView Catalyst and in a web browser using trame. Ensure you’re effectively leveraging ParaView by taking advantage of these features.
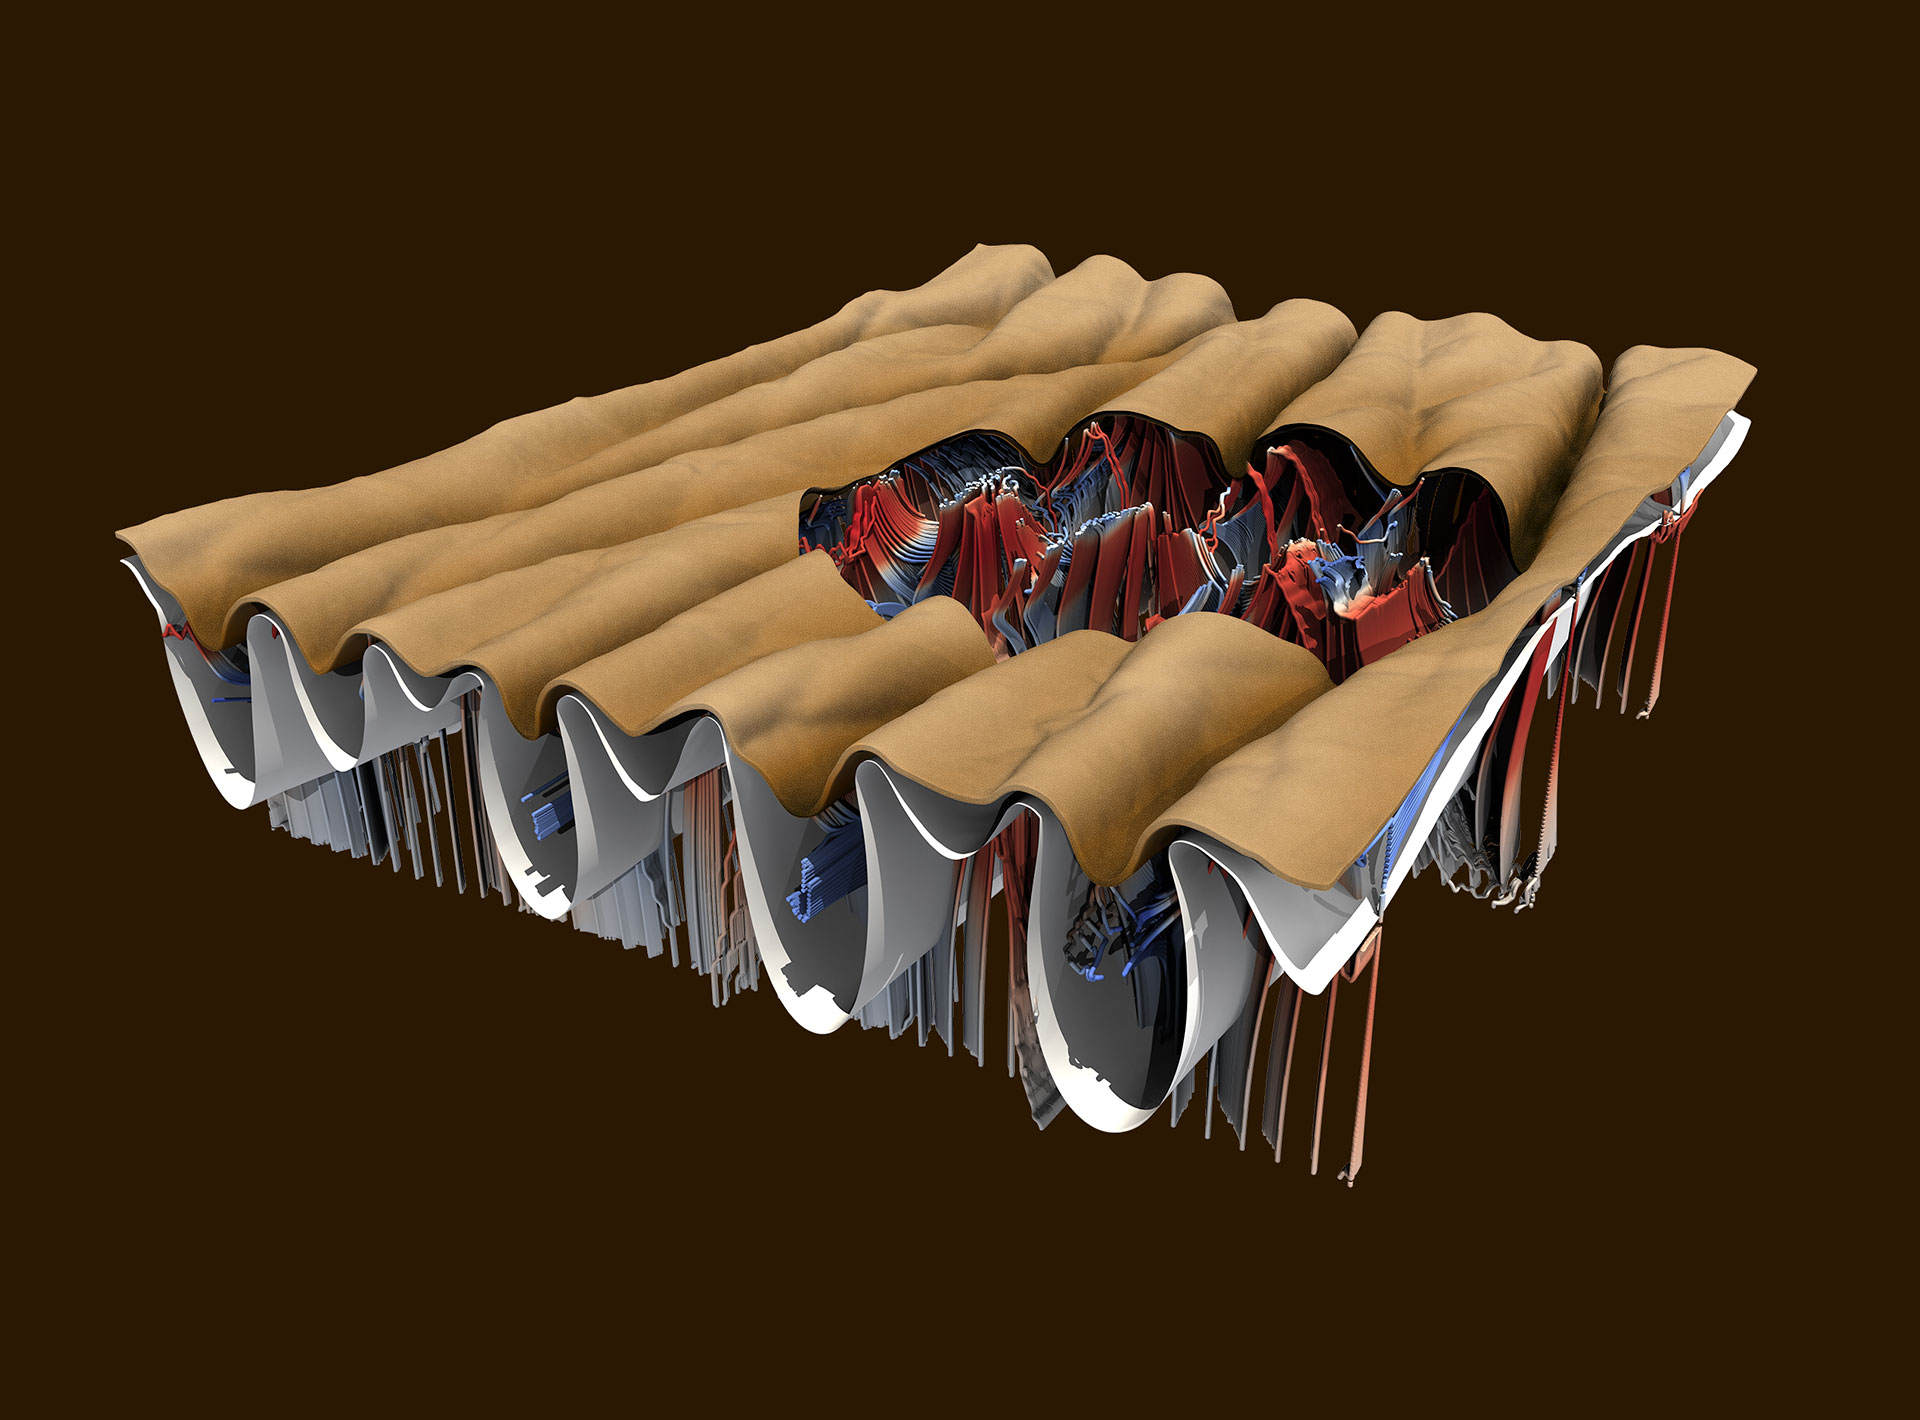
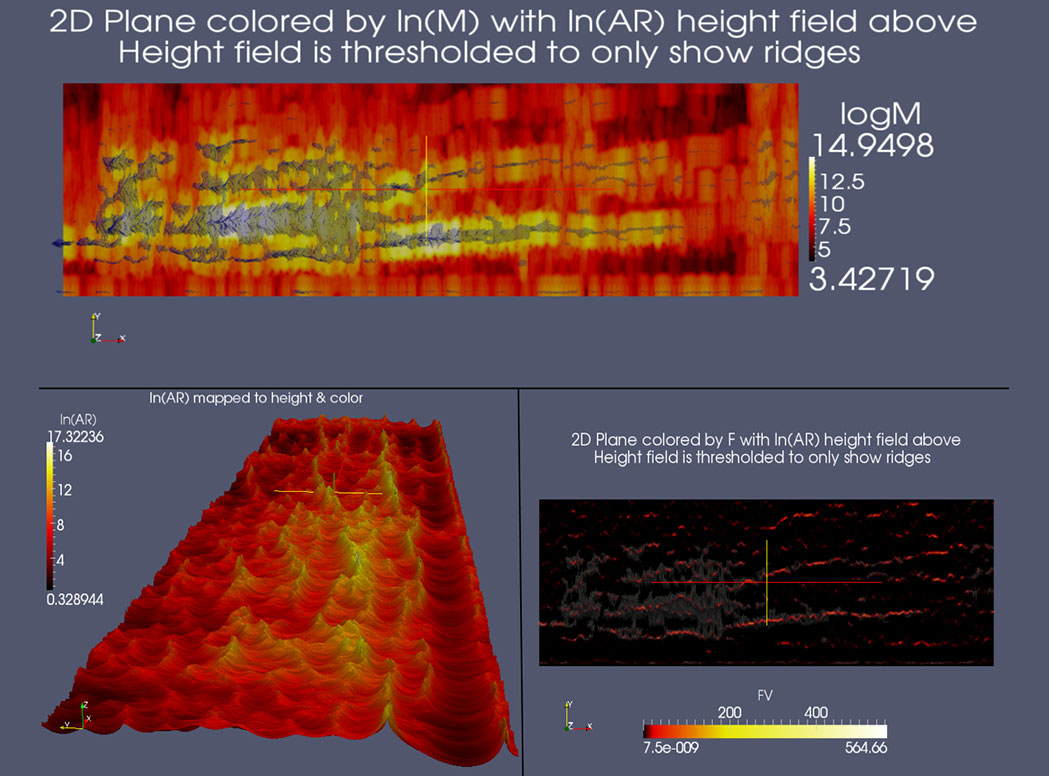
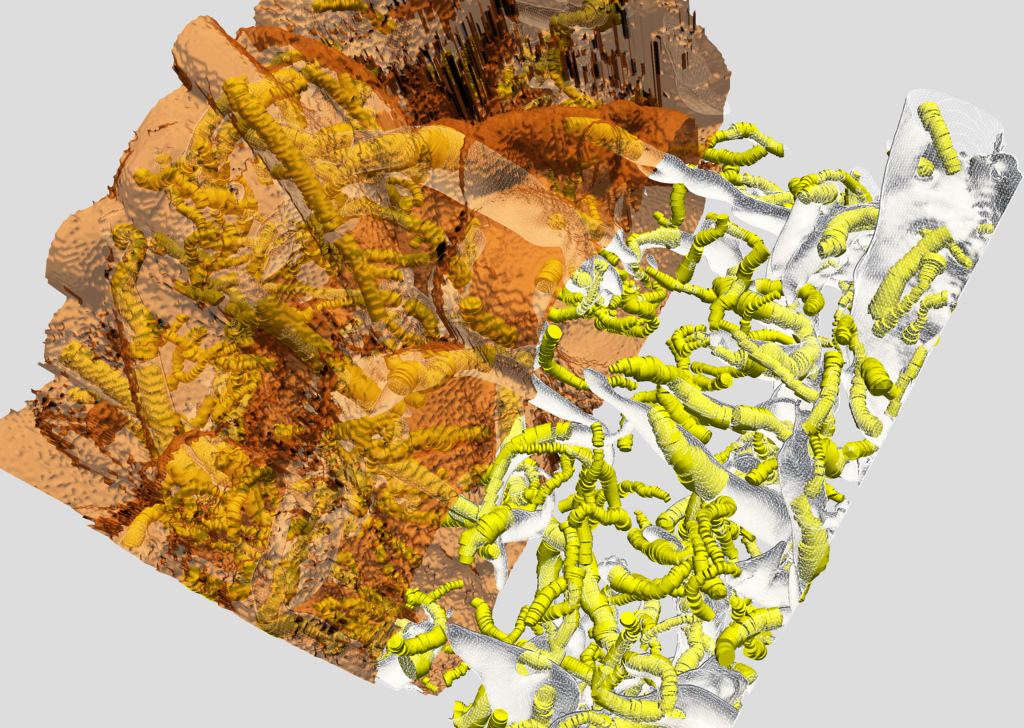
Gallery
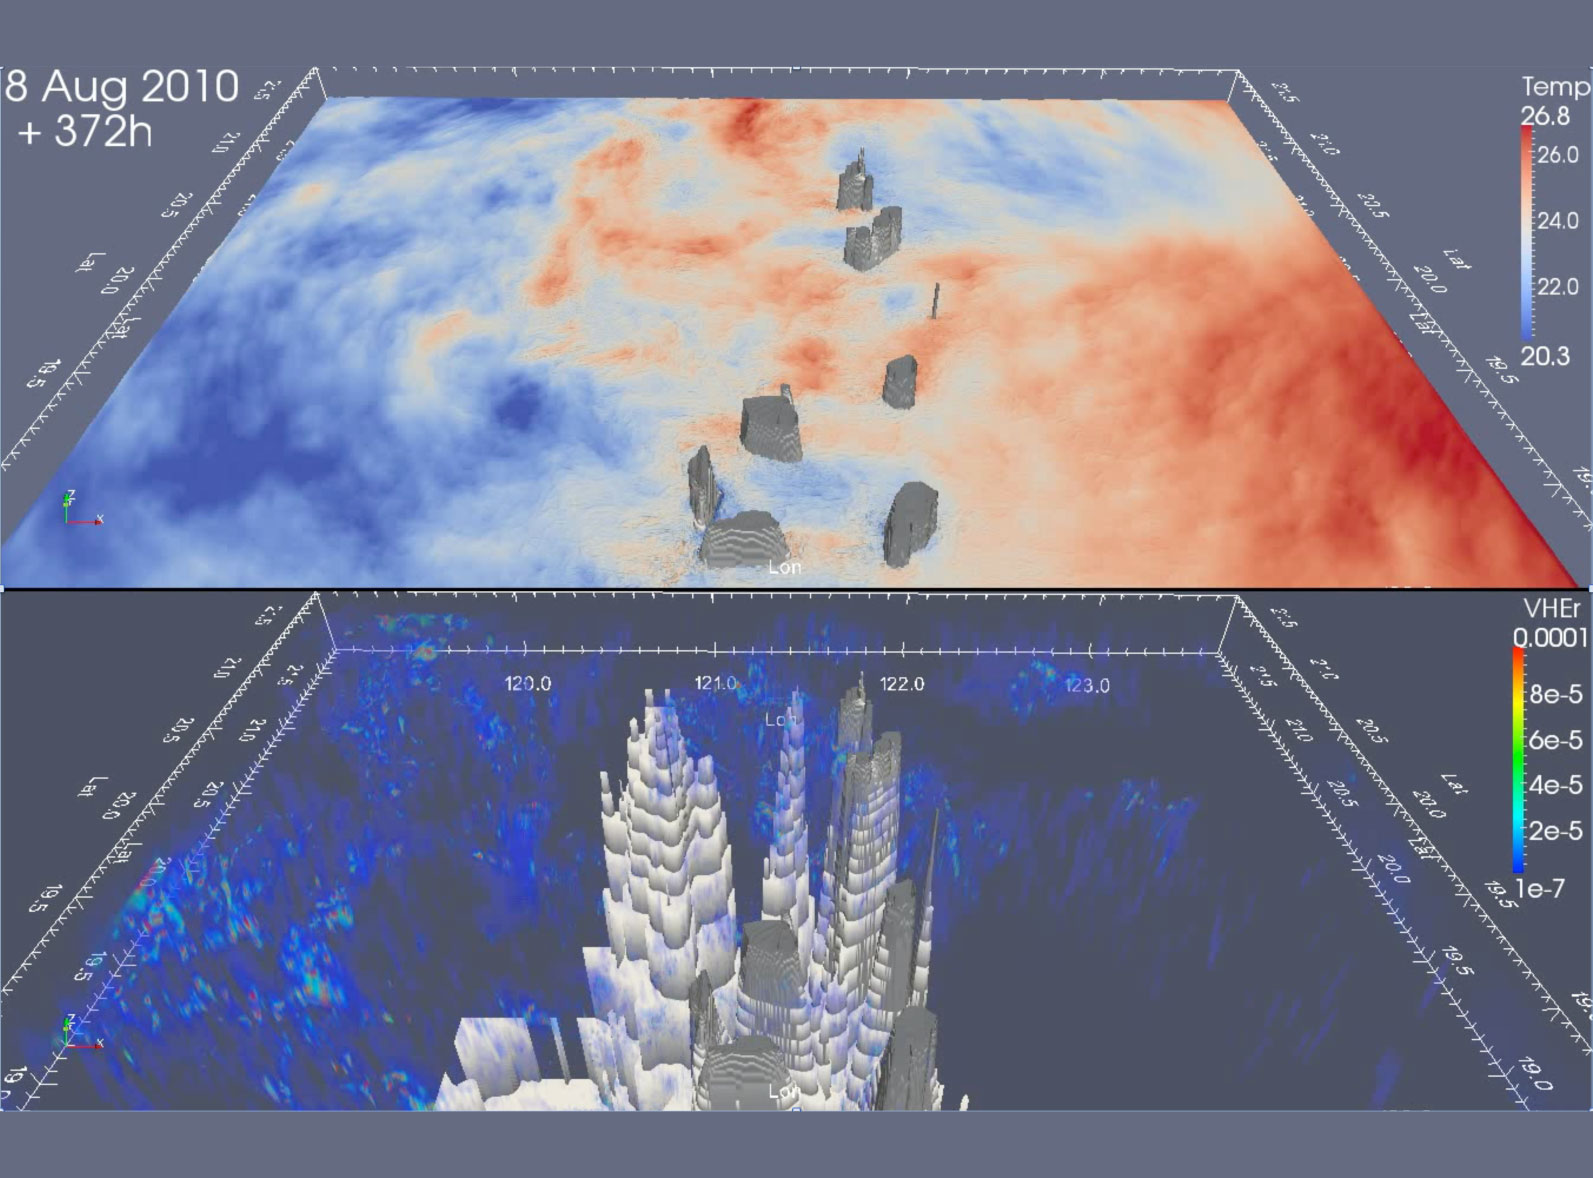
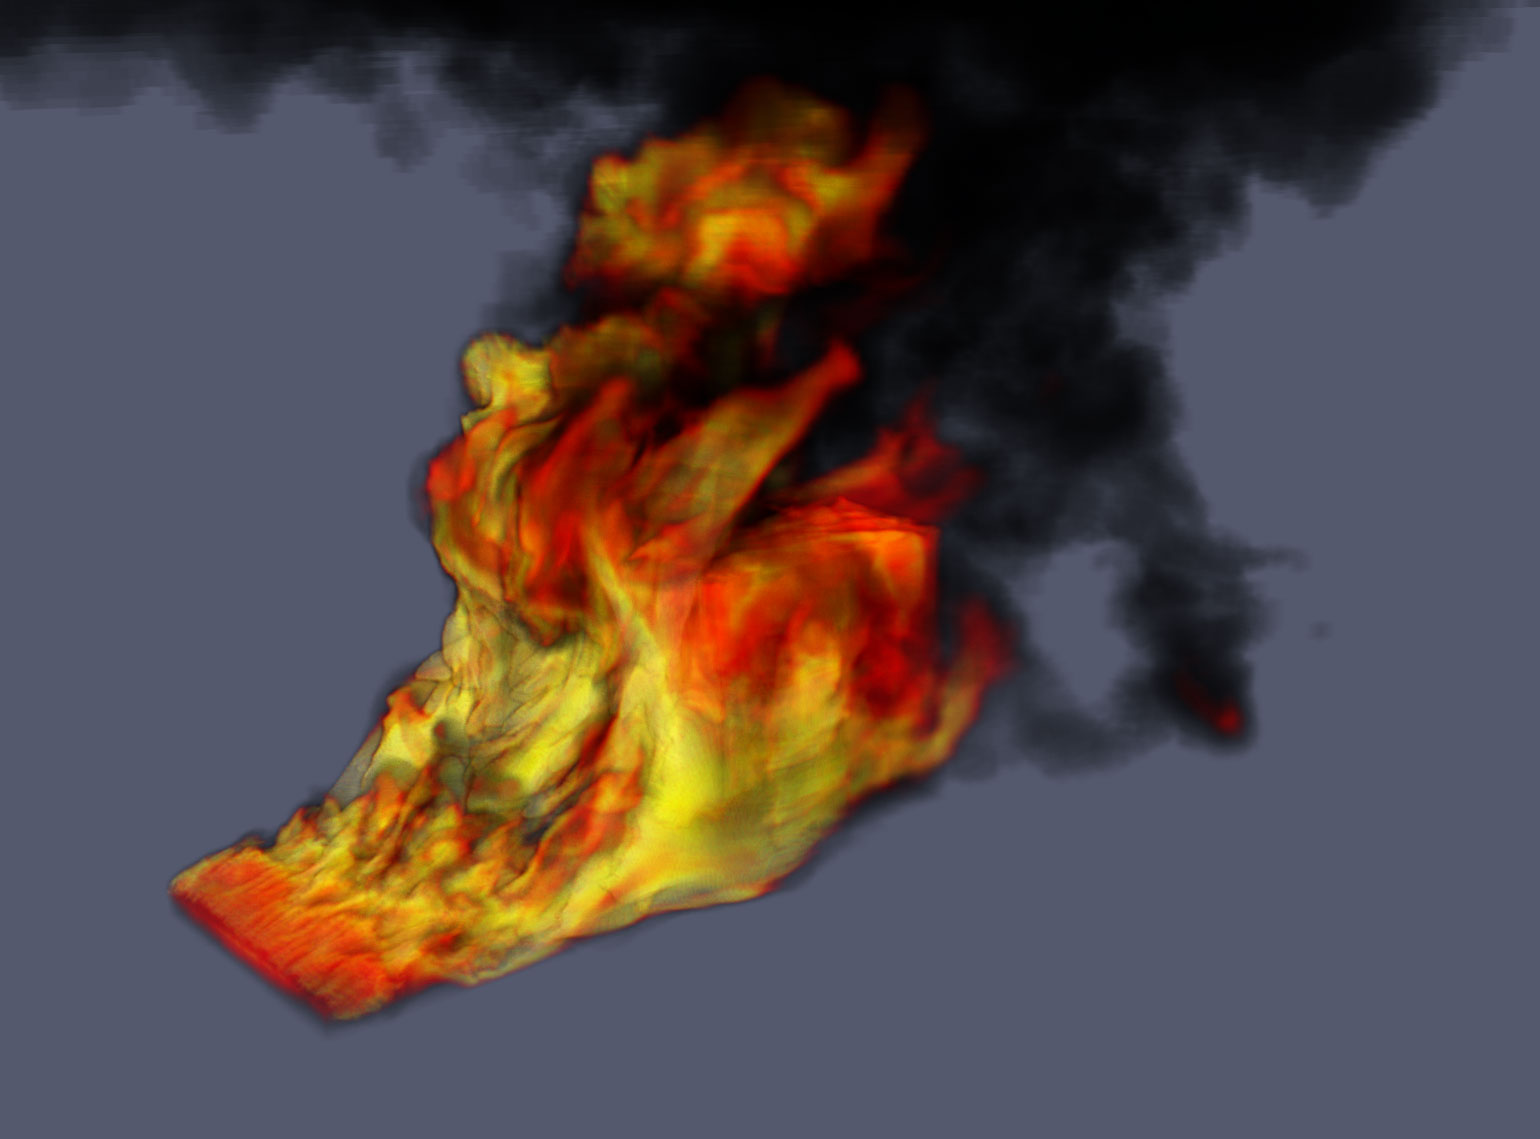
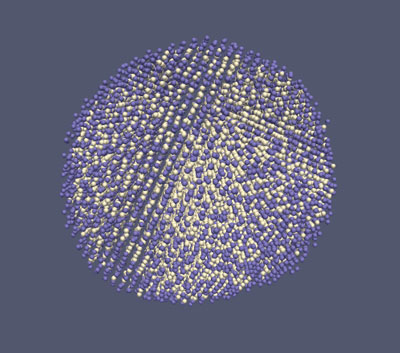
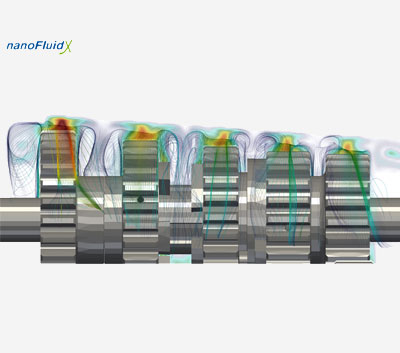
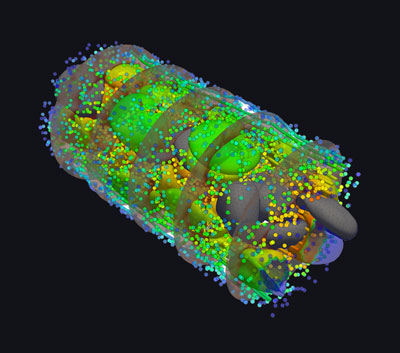
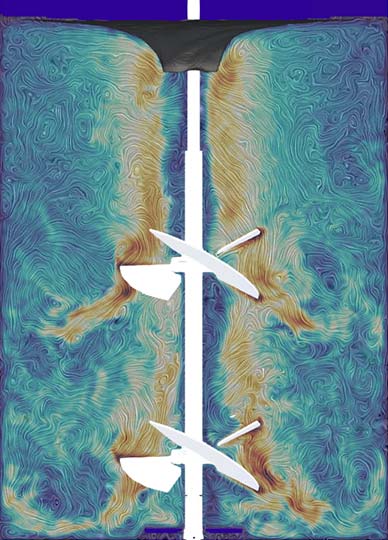
See ParaView in Action

Solutions
See all the ways you can use ParaView


Learn how to use our platforms from the experts who developed them
Kitware holds training courses throughout the year, but can also create a custom course for your team. Visit our trainings page to learn more.
From Our Blog
Download ParaView
ParaView is an award-winning open source visualization application that users have trusted for more than 20 years. Start exploring your data using this powerful tool, for free, today. Kitware–the developers behind ParaView–also offers Customization services.
ParaView Contributors